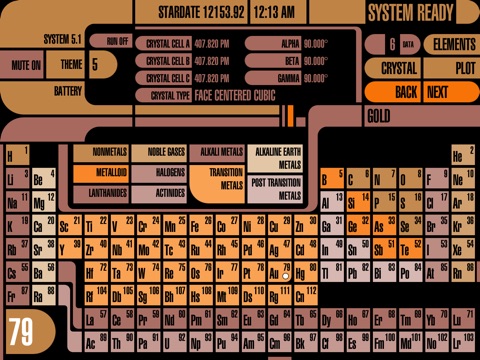
Element Trek is an interactive Periodic Table of the Elements, augmented with interactive (and animated) 3D models of their crystal structures (see screenshots below) and a vast array of technical data, including 24 plot charts. Using the Bohr model, the electron shells and subshells are presented graphically with the ability to expand any atomic shell into its component subshells to see their electrons. Additionally, there is a scrollable chart that shows the positions of the relative energy levels for all of these shells and subshells from lowest to highest, along with the magic numbers for filled shells.
(The Mac version is now available.)
The absorption spectra and emission spectra of each element can be displayed graphically, and simultaneously in list format that shows the value of each wavelength in nanometers and the wavelength intensity by percentage.
You can view a graphical representation of the melting point and boiling point of each element with simultaneous readouts in Fahrenheit, Celsius, and Kelvins. Additionally there is a chart that plots all of the melting points (and another for boiling points) for all of the elements.
All of the Ionization Energies for each element can be displayed graphically in either eV (electron volts) or switched to kJ/M (kiloJoules / Mole), and dragged across to reveal specific values.
The Periodic Tables shows the atomic number and atomic symbol of each element, and each element entry is color-coded according to the Category of the element. In the main Periodic Table, tapping any element will show the values of various properties of that element in the data readouts section. There are 6 sections of data that can be specified individually, or set to automatically advance and autorepeat.
There is a view which shows a chart of all of the Oxidation States for each each element, listed in ascending order by atomic number.
ELEMENT PROPERTIES:
Element Name
Atomic Number
Atomic Symbol
Category
Block
Phase
Group
Period
Atomic Weight
Protons
Neutrons
Electrons
First Ionization Energy
All Ionization Energies
Melting Point (K, F, C)
Boiling Point (K, F, C)
Atomic Radius (Calculated)
Atomic Radius (Experimental)
Covalent Radius
Van der Waals Radius
Electronegativity
Electron Affinity
Magnetism
Density
Oxidation States
Electron Structure ([Rn] 7s2 5f7)
Crystal Structure Type
Crystal Cell Dimensions and Angles
Critical Pressure
Critical Temperature
Heat of Fusion
Heat of Vaporization
Specific Heat
Thermal Conductivity
Thermal Expansion
Resistivity
Electrical Conductivity
Speed of Sound
Color
Valences
There are 44 different color themes to choose from that use futuristic graphics.
FEATURES:
• Interactive Periodic Table of the Elements
• 3D Crystal Structures (Interactive / Animated)
• Atom Structure (Bohr Model, Shells / Subshells)
• Absorption Spectra
• Emission Spectra
• Ionization Energies Chart
• Melting Points Chart
• Boiling Points Chart
• 10 Element Category Essays
•
•
• 44 Color Themes
• Digital Clock
• 12 Hour or 24 Hour Time
• 2 StarDate Types
• Integrated Battery Status Readout and GUI
• System Version Readout
• Cool Sound FX
• Mute Sound FX, for Silent Operation
Live Long and Prosper //


